


This article is the first in a two-part series examining supply chain leakage that costs asset-intensive companies millions of dollars and the solutions to address them. In Part 1, we explore why the leakage persists and where they remain hidden, drawing on examples from a global asset-intensive operator managing multiple integrations.
In asset-intensive operations, supply chain leakage occurs where processes overlap. These overlaps include instances where master data does not support inventory decisions, where inventory visibility does not influence procurement, where procurement controls do not reflect demand, and where operational teams work around systems they distrust.
A global asset-intensive operator managing multiple integrations faced this challenge. Despite having systems, processes, contracts, and capable teams in place, execution reverted to legacy practices and workarounds under operational pressure. This occurred due to a gap between enterprise intent and day-to-day execution.
When Process Exists, But Execution Still Leaks Value
YCP Renoir conducted an operational diagnostic based on the principle that master data, inventory, procurement, and maintenance workflows form an integrated system. Fragmentation in one area has an impact elsewhere.
For example, a duplicate material code can distort stock visibility, split buying volume, weaken contract leverage, and trigger unnecessary purchases. A stock item with no consumption history indicates poor asset linkage, weak replenishment logic, or procurement that is disconnected from actual usage. A contract bypass stems from poor catalog visibility, urgent operational pressure, or inconsistent material identities.
Across the three pilot assets included in our diagnostic, the initial fact base revealed:
| Indicator | Finding | What is signaled |
| Inventory base across the three pilot assets | ~USD 161mil | Significant working capital tied up in stock |
| Inventory coverage | ~7 years | Stock levels materially above consumption |
| Duplicate material codes identified | 17% | Material catalog fragmentation |
| Procurement with no subsequent recorded consumption | ~USD 10.4mil | Buying volumes were not consistently aligned with actual demand |
| Purchases despite stock availability | ~USD 1.7mil | Existing inventory was not consistently influencing buying decisions |
| Survey concern level on system trust and utilization | ~73% | System adoption and confidence gap |
Why Supply Chain Leakage Remains Hidden
Supply chain leakage is difficult to detect because each individual function seems reasonable on its own. Master data teams process requests. Inventory teams ensure operational continuity. Procurement teams respond to requisitions. Maintenance and operations teams request materials to ensure asset uptime. Each team justifies its decisions from its own perspective. Financial leakage emerges when these decisions interact:
- Master Data X Inventory: Equivalent items have different material identities. This leads to duplicate stock, excess holdings, and poor catalog visibility.
- Master Data X Inventory: Equivalent items are purchased under different codes, from different suppliers, or with different descriptions. This results in price variance, fragmented demand, and reduced sourcing leverage.
- Inventory X Procurement: Purchases continue despite stock availability or the absence of a consumption signal. These avoidable purchases lead to over-coverage and urgent buying behavior.
- Procurement controls: Framework agreements exist, but they are not consistently used. There is contract bypass, repeated negotiation, and unmanaged spot buying.
Supply chain management (SCM) value recovery requires a cross-functional approach. Issues originating in master data compound in inventory and procurement. Misalignment in one area cascades through decision rights and workflows. Leakage does not stay isolated; it spreads across the system.
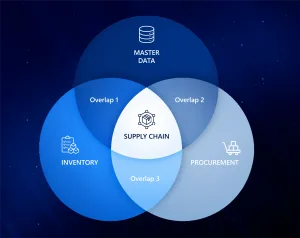
Figure: SCM leakage sits in the overlaps between master data, inventory, and procurement.
Building The Diagnostic View
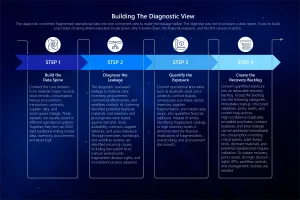
The diagnostic converted fragmented operational data into one connected view to make the leakage visible. The objective was not to produce a data report. It was to build a fact base showing where execution broke down, why it broke down, the financial exposure, and the first course of action.
The diagnostic engine followed four connected steps:

Stay tuned for Part 2 of this series. In the next part, we will discuss the value case using our structured process, outline the tailored roadmap we developed for the operator, and share key lessons for asset-intensive operators facing similar supply chain complexities.
Are you unsure where value is leaking in your supply chain?